Advanced Visual Analytics for Process Intelligence
Empowering process engineeers with advanced visual analytics
Industry
Industrial process dataTech Stack
- PostgreSQL
- TimescaleDB
- Ruby on Rails
- Redis
Arrangement
- PoC
- Fixed-term
- Retainer
The Challenge
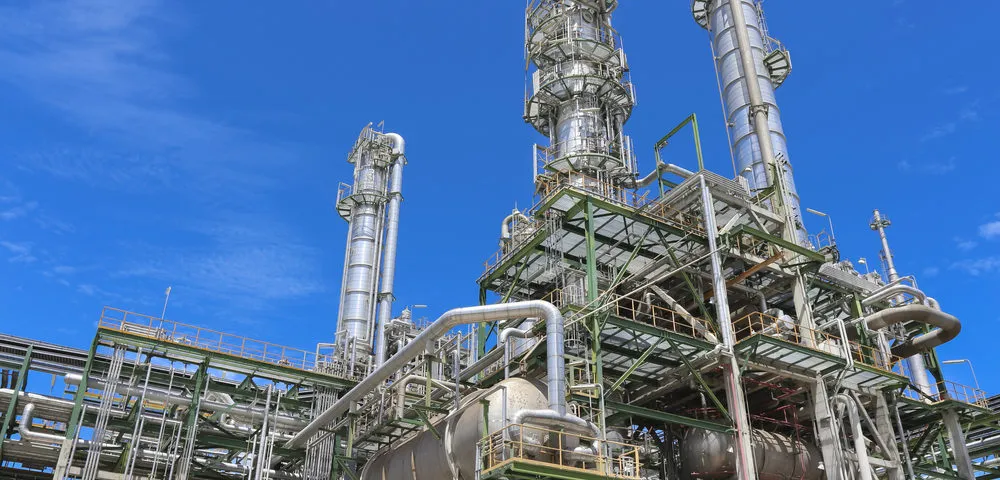
Modern chemical process plants record a gargantuan amount of data. With a typical plant recording measurements from thousands or tens of thousands of sensors at sub-minute frequency, extracting meaningful insights from this data poses a practical challenge for process engineers.
General-purpose, off-the-shelf analytics tooling lacks contextual features that are essential to interprete sensor readings, segment operating conditions, perform root-cause analyses, and understand the directional changes required to drive a plant towards optimality.
Performance is also a major consideration, with multi-gigabyte datasets being commonplace. Process engineers are often stuck with slow, sub-optimal tooling, impeding their decision making abilities. This leads to missed opportunities and waste, which materially impact the plant’s bottom line.
Our client, Alpha Process Control Srl. - experts in process control & optimisation - experienced this frustration first hand in dozens of process plants across Europe & Asia. They approached us to collaboratively develop a better way.
The Solution
The result of our collaboration was Visual Process Intelligence (VPI) - a next generation data aggregation, processing and visual intelligence platform, specifically optimsied for process data.
Advanced data visualisation: The application provides fully featured multi-variable trends, scatter plots, histograms, and other visual inspection tools optimised to work seamlessly on millions of data points with no latency.
Best-in-class parallel coordinates: Classical visual analytics tools are insuffiucient to decompose the high dimensionality and complexity of relationships between variables in complex plants. VPI offers a custom, best-in-class parallel coordinates visualisation - an advanced multivariate visualisation tool that surfaces hidden relationshps between variables in minutes.
Precise segmentation and data conditioning: VPI supports precise segmentation of operating conditions based on compound time or variable conditions, making it easy to incrementally identify sub-optimal operating conditions, missed opportunities, and root causes.
>10M
Typical data points visualised
1TB
Typical database size
80%
Faster root cause analysis
The Outcome
The platform and vendor independent visualisation platform distils 120 combined years across process control and optimisation to deliver advanced visual analytics, rapid diagnostics and root-cause identification, and deeper process understanding.
VPI has now been installed in some of the worlds most complex industrial environments (Shell Singapore, GS Caltex), and is readily delivering improved operational efficiency, fewer missed opportunities, and a material improvement in the plant’s bottom line.
Ready to discuss your project?
Let's talk about how we can help with your engineering challenges.
Or email us directly at [email protected]